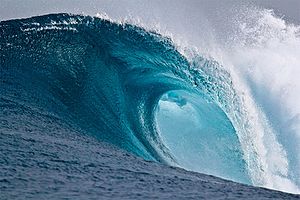
| A light pulse propagating in a nonlinear medium behaves as a fluid which may experience wave breaking. At variance with what occurs for a wave along the seashore, this does not result in a breaker, but rather in a nonlinear structure known as a « dispersive shock wave », analogous to the undular bores formed at some estuaries and which can travel upriver for miles.
The undular bore consists in an initial large amplitude nonlinear wave (almost a solitary wave) followed by periodic « whelps » of decreasing amplitude which eventually degenerate in linear disturbances. |
|
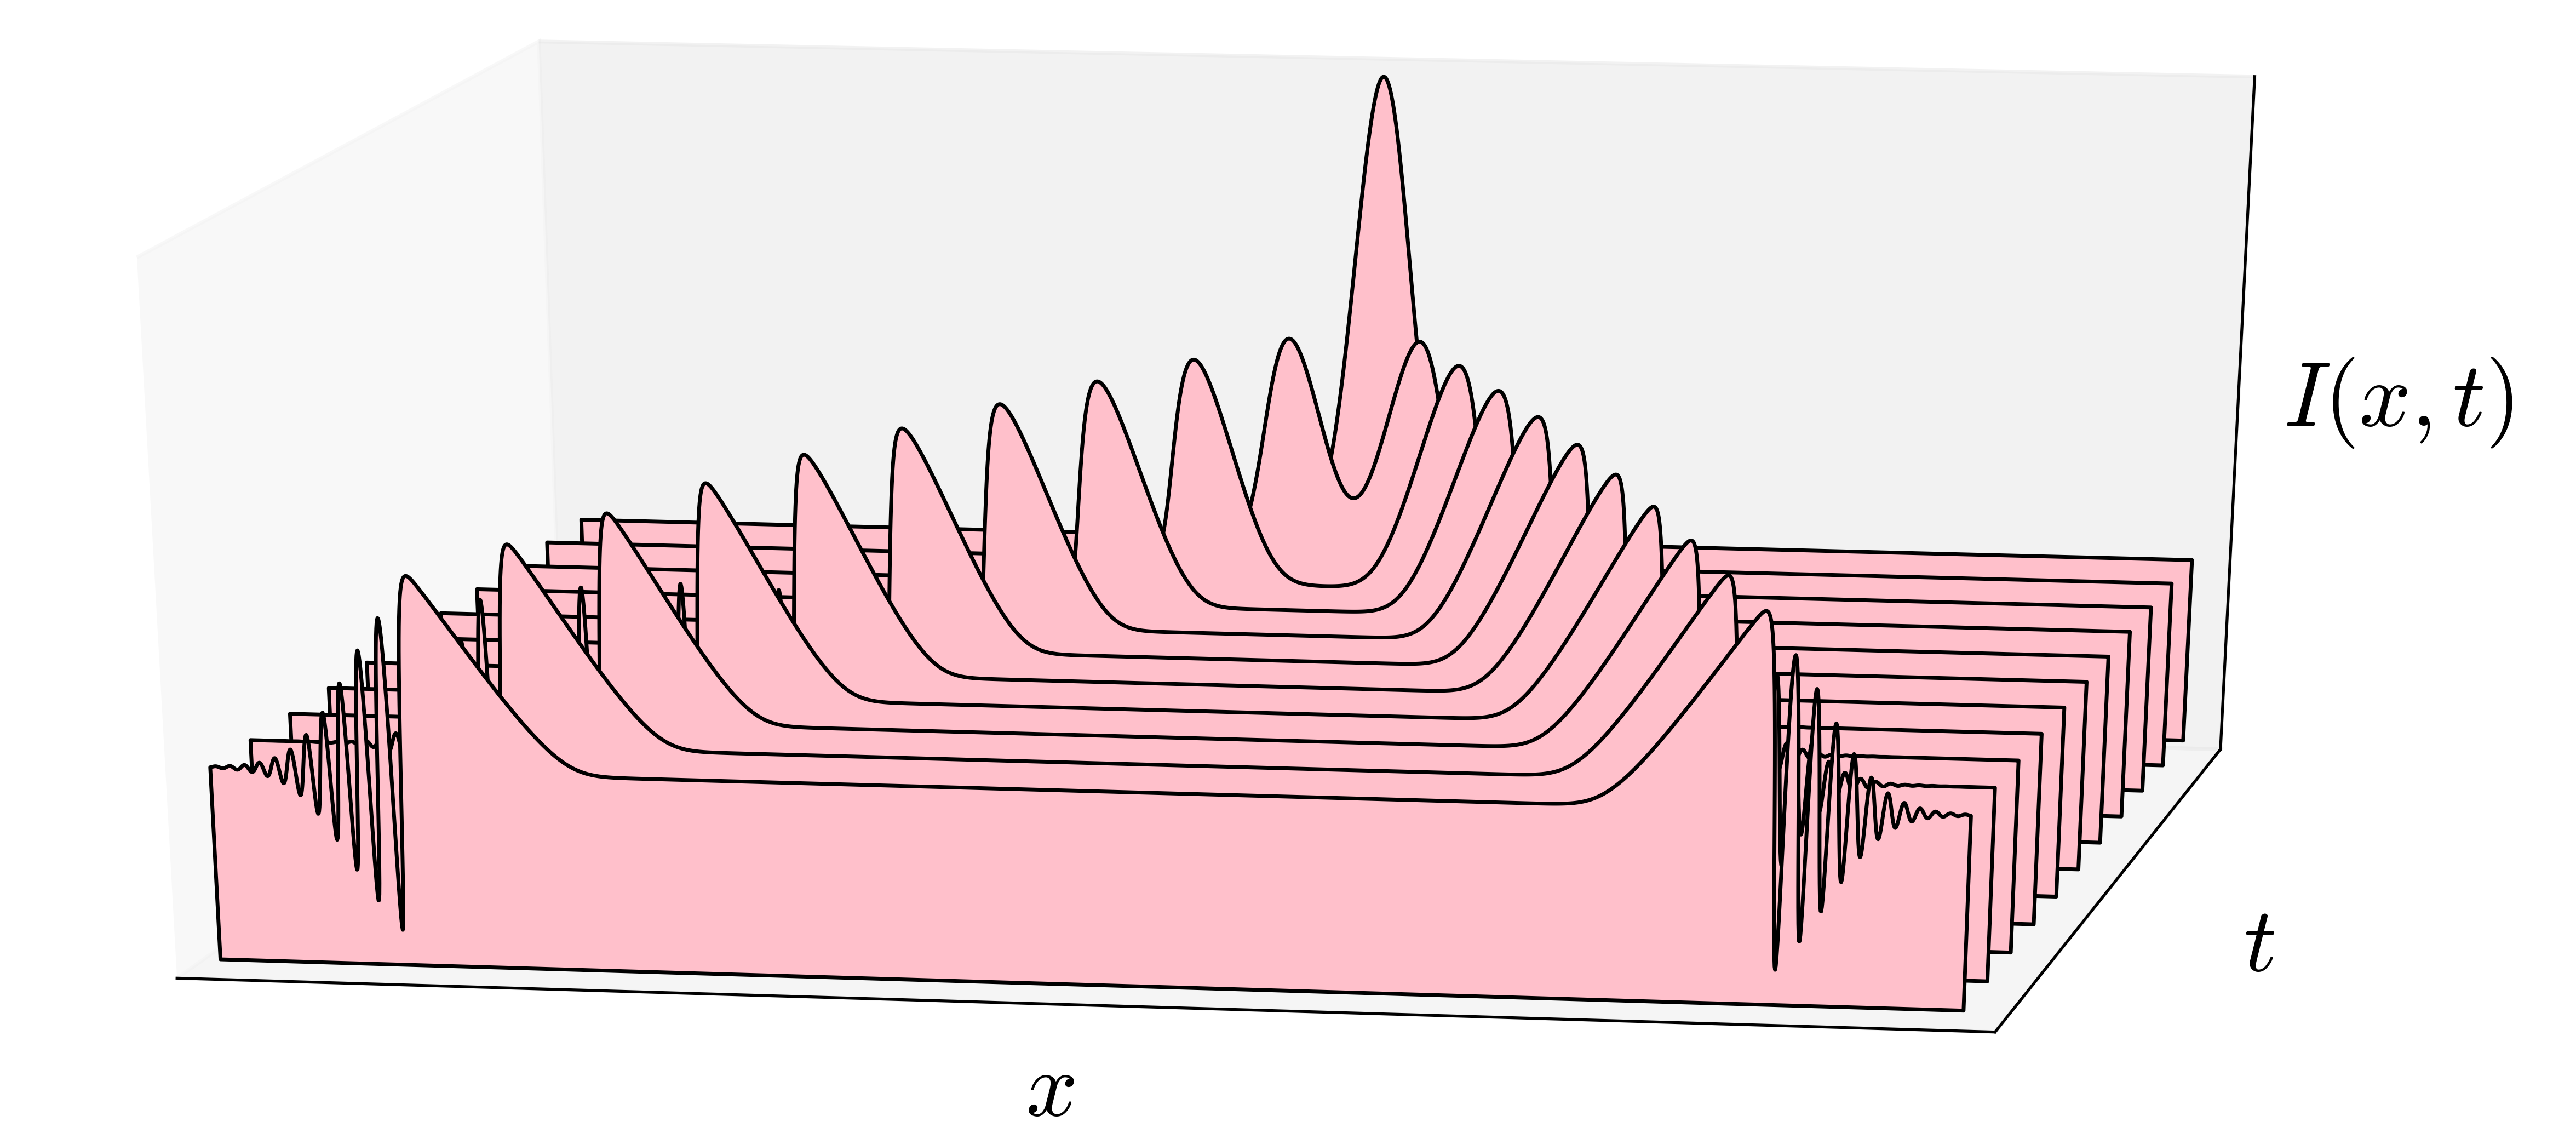
The figure below represents the time evolution of a region of increased light intensity in a simplified 1D geometry. The initial bump splits into 2 counter-propagating pulses whose leading fronts steepen, leading to wave breaking followed by the formation of two dispersive shock waves (regions of rapid nonlinear oscillations at both ends of the structure).
It is possible to describe the formation and evolution of the dispersive shock of light by means of a mathematical approach whose results compare very well with numerical simulations and experimental results. The theory yields simple asymptotic formulae for the parameters of the shock, making it possible to characterize the different types of behaviors of the light wave and to identify the best experimental situations for observing the dispersive shock. Details in PhysRevA.99.053819 and PhysRevE.102.03221
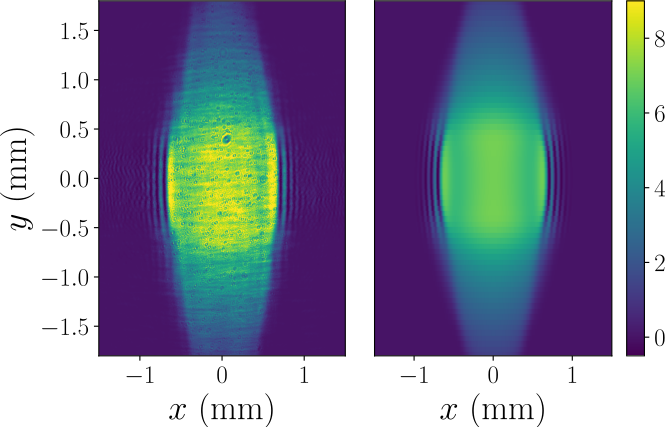
An optical shock wave has been realized in a work in collaboration with a team at LKB (T. Bienaimé, A. Bramati, Q. Fontaine and Q. Glorieux). A specially designed laser beam is sent onto a nonlinear optical cell. The figure below represents the intensity of the beam imaged at the output of the cell. It displays fringes characteristic of a dispersive shock wave [at y=0 mm and x=(+/-) 0.7 mm]. The left plot is the experimental beam profile and the right plot the theoretical prediction. Details in PhysRevLett.126.183901